Conduction Time Series
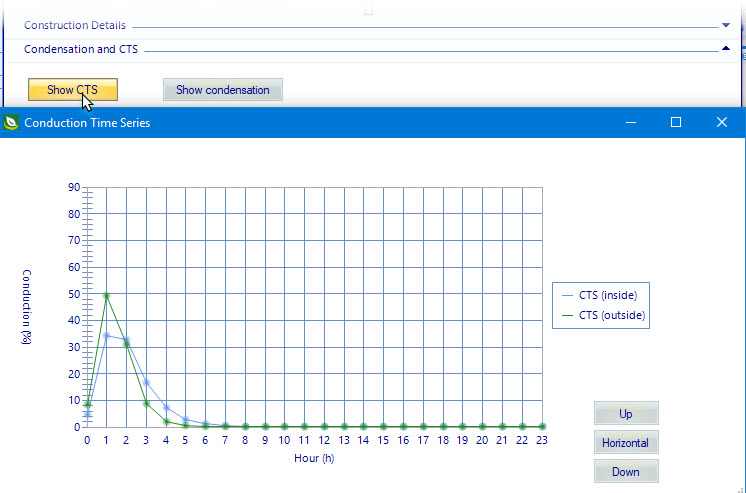
The Materials Manager opens Conduction Time Series. It is used to review conduction time series (CTS) values for selected constructions. The interactive CTS graph displays the values when the pointer is positioned over the plotted points.
Conduction time series is a series of conduction time factors for a construction over a 24 hour period. OpenBuildings Energy Simulator derives construction CTS graphs based upon the thermal properties of each material type that makes up the construction.
Heat gains from exterior surfaces is affected by the rate
of conductive heat transfer through them. In order to determine this rate, OpenBuildings Energy Simulator uses conduction time series (CTS) values.
Each exterior construction has 24 different CTS percentage values, summing to
100%, that indicate how much of the heat stored in the envelope has come
through after a given amount of time.